2.1.4 Keynesian AS/AD Analysis
In this section, we will focus on the Keynesian AS to undertake AS/AD analysis.
It looks like this:
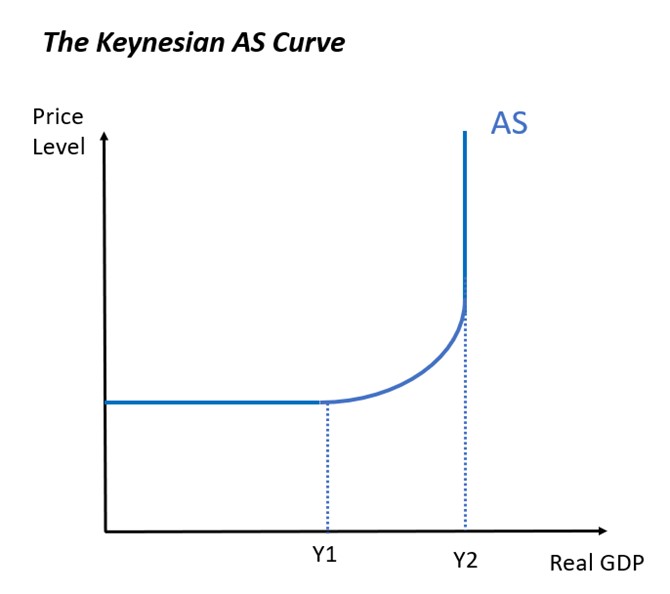
The Keynesian AS Curve (AS) has three sections:
- Inelastic section where the economy is at full capacity (full employment): Y2.
- An upward-sloping section when the economy is nearing full capacity; between Y1 and Y2.
- An elastic section where the economy may remain significantly below capacity in the long run; below Y1.
AD/AS Analysis using the Keynesian Curve
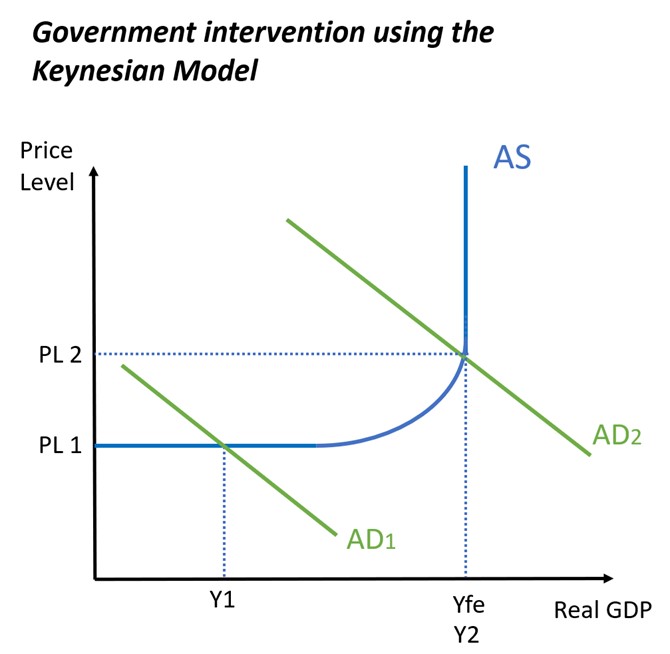
Say we have an AD/AS curve that starts here:
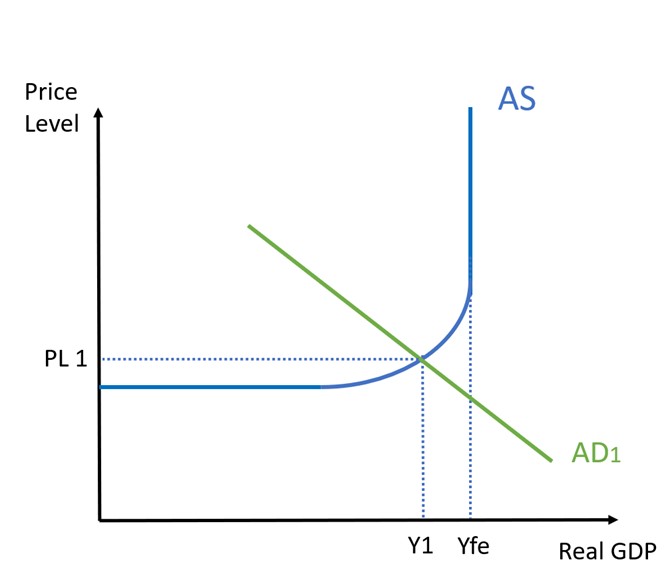
The model above shows a Keynesian AD/AS model with AD just at the point where AS is beginning to be inelastic. Yfe refers to “output at full employment”; in other words, output when all factors of production are employed (our productive capacity).
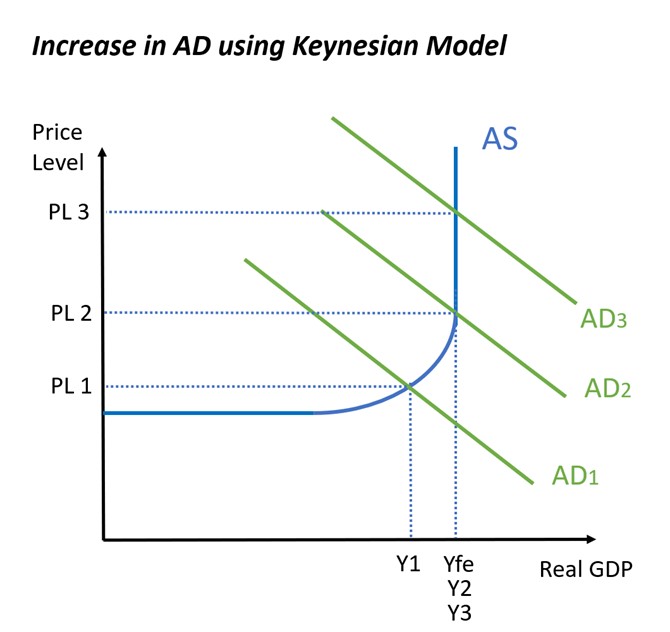
This is a nice little model that helps us to explain two things:
- When we have increases in AD and we’re at full capacity, we see inflation:
- When we have decreases in AD and we have spare capacity, we have persistently high unemployment:
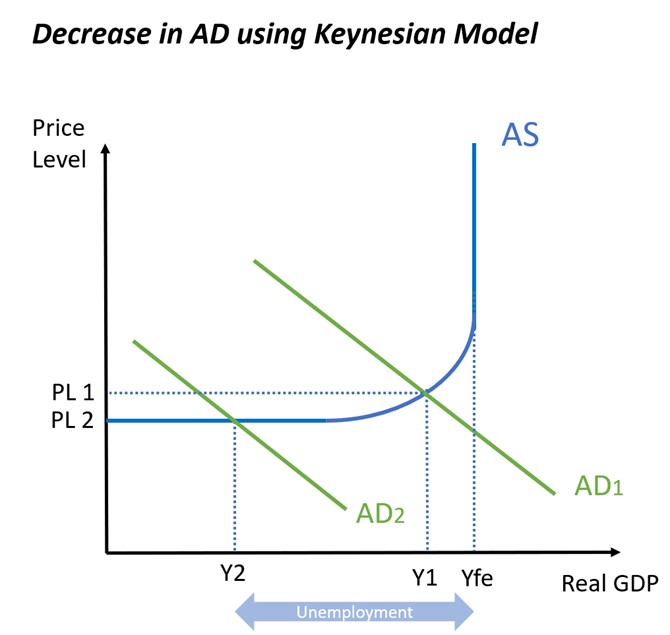
In the example above, unemployment is reprsented by the difference between Yfe and Y2. This is the difference between what we would be producing if everybody was working (Yfe) and what we are producing currently (Y2). The loss of output/income is due to people who could be working but are not.
Keynes argued that unemployment could persist in the long term because of sticky wages. This means that wages are easy to adjust upwards, but are more difficult to adjust downwards. Your workers will notice and want to avoid nominal wage decreases, so they will put up a fight if you try to decrease their wages. They might have their wage levels written into their contract, for example, meaning that businesses cannot change them. Or they may threaten to go on strike if you try to renegotiate for lower wages. The point is that wages are not flexible; businesses cannot adjust them down to allow them to hire more workers.
Think of it this way: the fall in AD from AD1 to AD2 has meant that many people have lost their jobs and are unemployed (Yfe – Y2). All these unemployed people will make it easier for businesses to offer lower wages. After all, businesses will be in a stronger position to offer low wages if they know that there are queues around the street full of unemployed people who want to work for them. And, in fact, if they were to lower their wages they could afford to hire all of these unemployed people, and the economy would go back to unemployment.
But the problem is that the workers who still have their jobs will not accept this. They have the power (e.g. through their unions) to see that firms do not cut their wages. So they keep their job at their high wage, even though there are unemployed people who would be willing to work for lower wages.
This all refers to the degree of flexibility in the labour market. The more flexible the labour market, the more power the firms will have to lower wages of their workers, and the less ‘sticky’ wages will be.
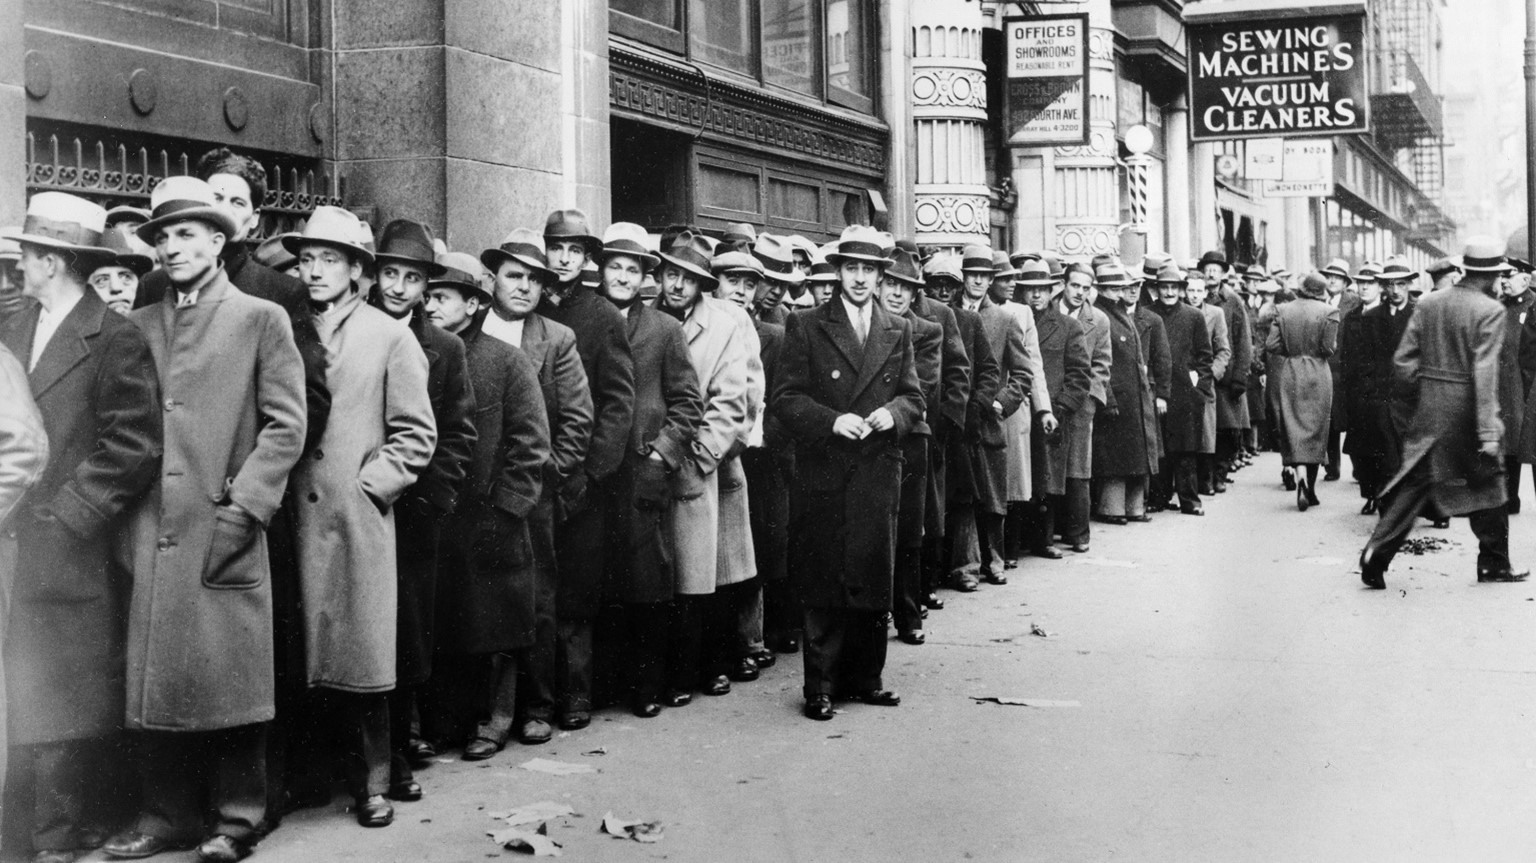
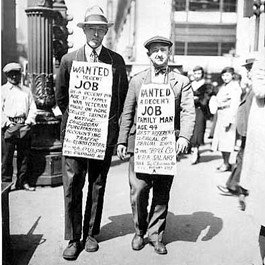
This all may seem very abstract and theoretical, but it’s worth noting the context of when Keynes was developing his ideas. The ideas that are now known as ‘Keynesian’ were put forward in his 1936 work The General Theory of Employment, Interest and Money. This was written at the height of the Great Depression in the UK and the USA, when there was widespread unemployment following the financial crash of 1929. Economists at the time assumed that if unemployment remained high enough for long enough, then wages would decrease and the economy would be able to self-correct to full employment. Keynes’ explanation for why this did not happen laid the intellectual foundation for government intervention in the economy: use government spending to kick-start the economy so that it would return to Yfe.
The idea of increased government spending during times of economic crisis became mainstream economic policy in the 1930s. This policy was implemented through the ‘New Deal’ programmes in the USA of the 1930s, where the US government spent money to build new public works projects. The policy of high levels of government spending was repeated globally following the 2008 financial crisis and the coronavirus pandemic of 2020.
Keynesian AD/AS analysis is a good place to start when looking at the effects of increases/decreases in AS or AD in an economy.
It’s also useful, however, to understand how to model the macroeconomy when we don’t assume that wages are sticky. To do this, we need to understand the Neoclassical AD/AS model.