Knowledge Organiser
1.2.1 Factors influencing demand and supply in product markets
- Define Demand.
- Define Individual Demand
- Define Market Demand
- Define Effective Demand
- Define Derived Demand
- State the Law of Demand
- Define Ceteris Paribus
- Define Marginal Utility
- State what is meant by Diminishing Marginal Utility
- Say the Price of a product increases. Use the Substitution Effect to explain why Quantity decreases
- Say the Price of a product increases. Use the Income Effect to explain why Quantity decreases
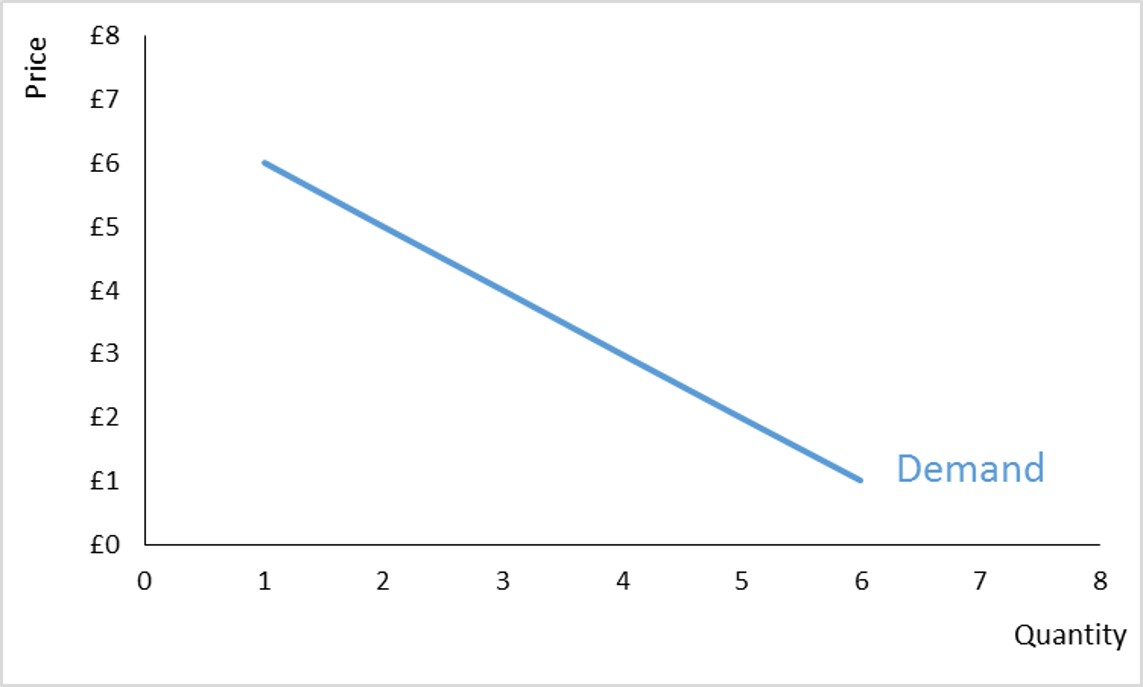
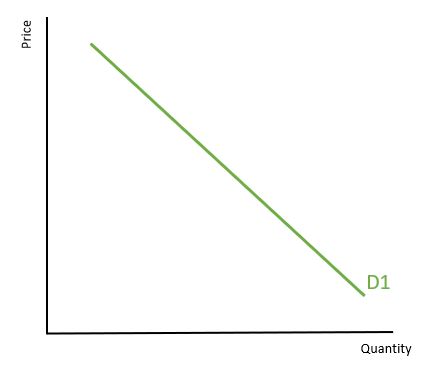
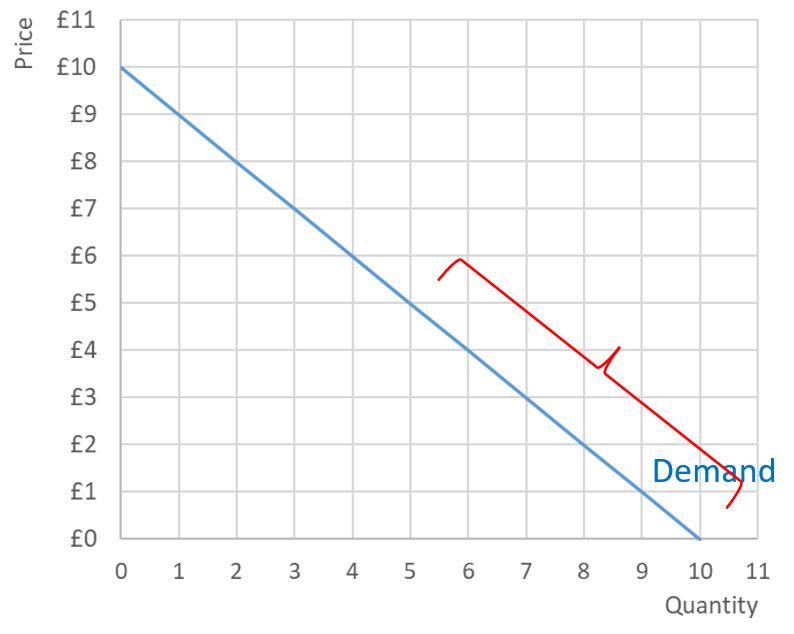
- Draw the Demand Curve
- What will cause a Contraction in the Demand curve?
- What will cause an Extension in the Demand curve?
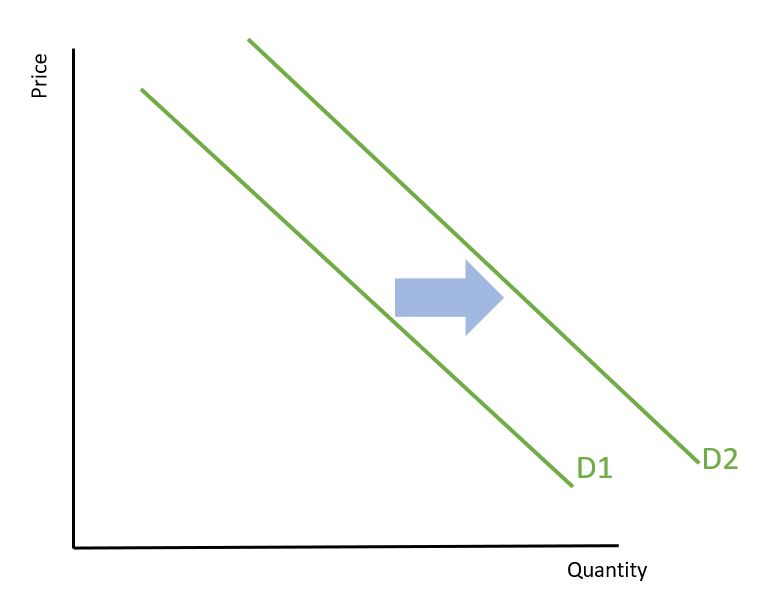
- What are the four main influences that will shift the demand curve?
- Define Complementary Goods
- Define Substitute Goods
- Say consumer income increases. What will happen the demand for a Normal good?
- Say consumer income increases. What will happen the demand for an Inferior good?
- Say that Goods A and B are Complementary Goods and the price of Good B goes down. What will happen to demand for Good A?
- Say that Goods A and B are Substitute Goods and the price of Good B goes down. What will happen to demand for Good A?
- If a product is featured on TV and suddenly is perceived to be 'cool', what will happen to the demand for the product?
- If the price of a product increases, what will happen to the demand curve for the product?
- If the price of a product decreases, what will happen to the demand curve for the product?
- What is a firm and what does it hope to maximise?
- Define Supply
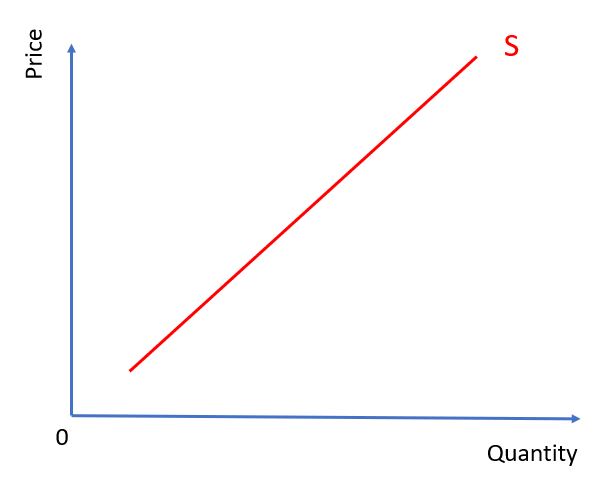
- Draw the Supply Curve
- Define Marginal Cost
- Why does marginal cost increase for firms as quantity increases?
- Why does the supply curve slope upwards?
- What will cause a Contraction in the Supply curve?
- What will cause an Extension in the Supply curve?
- What are some general factors that will shift the Supply Curve?
- Say the technology used to produce a product has improved in productivity. What will happen to the supply curve?
- Say the number of sellers of a good has increased. What will happen to the supply curve?
- Say the prices of inputs used to produce a good have increased. What will happen to the supply curve?
- Say a per-unit tax is imposed on the product. What will happen to the supply curve?
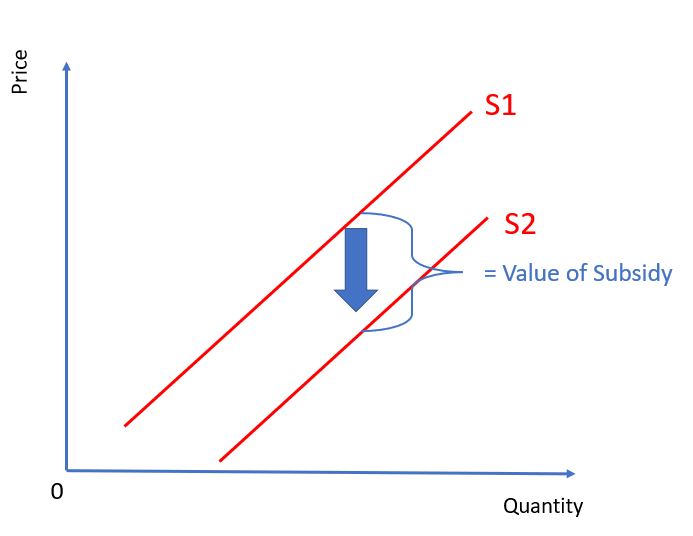
- Say a subsidy is given to producers of a product. What will happen to the supply curve?
- What type of goods would have a horizontal supply curve?
- What does constant marginal costs mean?
- What types of goods would have a vertical supply curve?
The quantity of a good or service that consumers are willing and able to purchase at any given price in a given time period.
The demand that an individual will have for goods and services at any given price.
The sum of of the individual demand of all the consumers in the market.
The consumer has the ability to pay for the product
When demand for one product is driven by the demand for another product.
Ceteris paribus, there is an inverse (negative) relationship between quantity demanded and the price of a good or service.
Latin for "holding other things constant". Meaning that when we change one variable, we assume all other variables are the same as they were.
The utility you get from consuming the next unit.
As we consume more of a product, the utility we get from consuming the next product deceases.
A higher price means the product now has a higher opportunity cost (in terms of other products). Consumers would now rather purchase these other products and buy less of the product that increased in price. (Even if they had a higher income, they would still prefer the other products)
A higher price means the consumers' real income is lower. They feel poorer, so they buy less of the product.
An increase in price

A decrease in price

-Income -Price of Complements -Price of Substitutes -Tastes and Fashion
Goods which are used together. e.g. tennis balls and tennis rackets
Goods that can be used as a replacement for each other because they serve the same purpose e.g. Coke and Pepsi
Demand curve shifts right
Demand curve shifts left

Demand curve shifts right
Demand curve shifts left
Shift right
No change in Demand curve. Quantity Demanded decreases (contraction/ movement along Demand Curve)
No change in Demand curve. Quantity Demanded increases (extension/ movement along Demand Curve)
A firm is a business It seeks to maximise profit
Supply is the quantity of a good or service that producers are willing and able to supply onto the market at any given price in a given time period.
The cost to a business of producing one more unit of production
Because of diminishing returns to the variable factor. "Too many cooks spoil the broth" As you increase output (in the short run) workers get in each other's way and become less productive, increasing the cost of producing the next unit.
-Selling at higher prices means more profit -Higher prices make up for increased marginal cost
A decrease in price

An increase in price

→ Technology → Expectations → Number of Sellers → Prices of other Goods → Input prices → Taxes and Subsidies
Shift right (More will be produced at any given price)
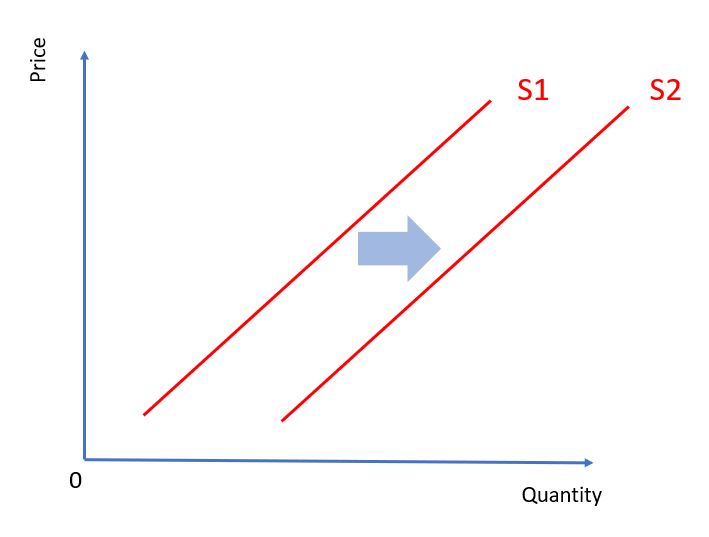
Shift right (More will be produced at any given price)
Shift left (Less will be produced at any given price)

Shift up Whatever price the producer was willing to sell at is now effectively higher, as tax must be added.

Shift down Whatever the price the producer was willing to sell at is now effectively lower, because the government is paying for production of the product.
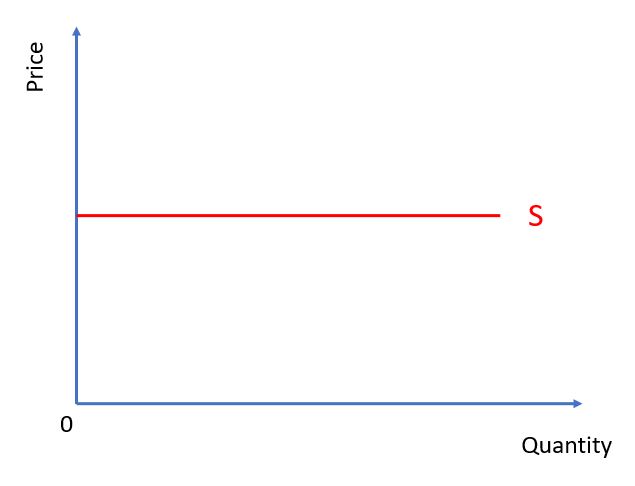
Goods with constant marginal cost i.e. good where you can increase production without seeing bottlenecks in production (e.g. Spotify)
Firms can increase production and their marginal cost doesn't increase (e.g. Spotify)
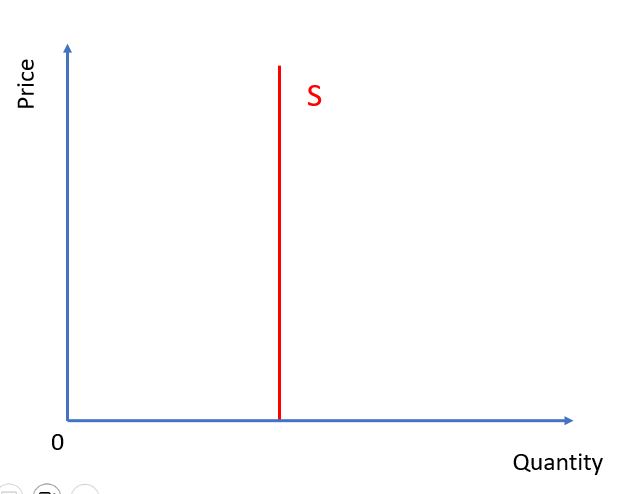
Goods which are in fixed supply i.e. you cannot increase supply e.g. Picasso paintings, concert seats, pumpkins (in the short term)
1.2.2 The determination of equilibrium price and output in a freely competitive market
- Draw a diagram showing excess supply. Explain what effect this disequilibrium will have on price
- Draw a diagram showing excess demand. Explain what effect this disequilibrium will have on price
- Explain the difference between a movement along a supply or demand curve and a shift in the supply or demand curve.
- Describe and draw the effect on equilibrium diagram of: Less Demand
- Describe and draw the effect on equilibrium diagram of: More Demand
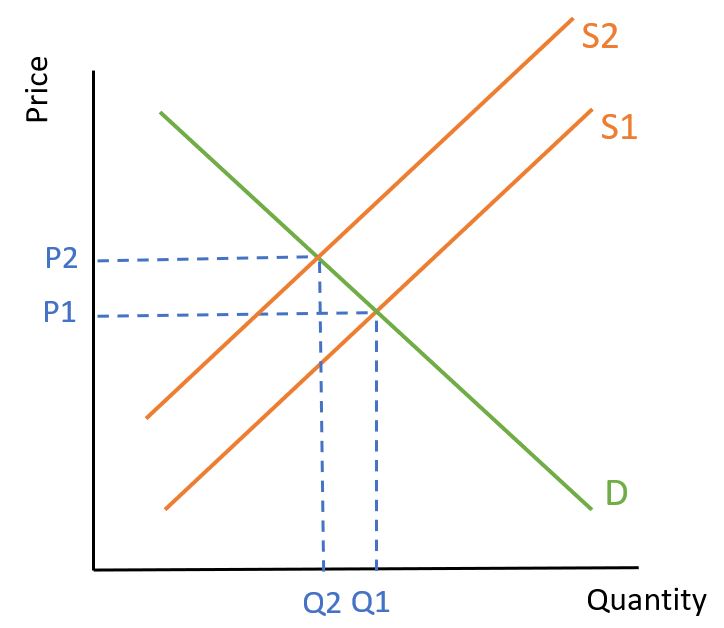
- Describe and draw the effect on equilibrium diagram of: Less Supply
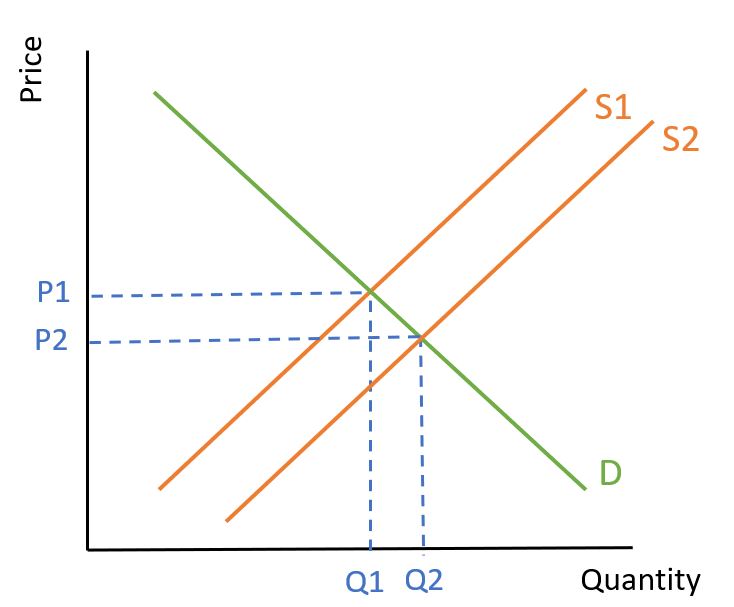
- Describe and draw the effect on equilibrium diagram of: More Supply
- Describe and draw the effect on equilibrium diagram of a double shift: More Demand and Less Supply
- Draw an equilibrium diagram following the imposition of a tax, showing the tax burden for both consumers and producers.
- Draw an equilibrium diagram following the a subsidy for the product.
At this point price is too high; supply is greater than demand. There is a 'glut' in the market. Sellers realise they have produced too much and lower prices. There is an extension on the demand curve and contraction in supply curve. Price will lower until equilibrium is reached.

At this point price is too low; demand is greater than supply. There is a 'shortage' in the market. Sellers realise they have produced too few products and raise prices. There is an contraction in the demand curve and an extension in supply curve. Price will rise until equilibrium is reached.

A movement along a curve occurs when price changes. A shift in the curve occurs when something besides price changes.
→ Demand shifts left → Lower Price → Lower Quantity
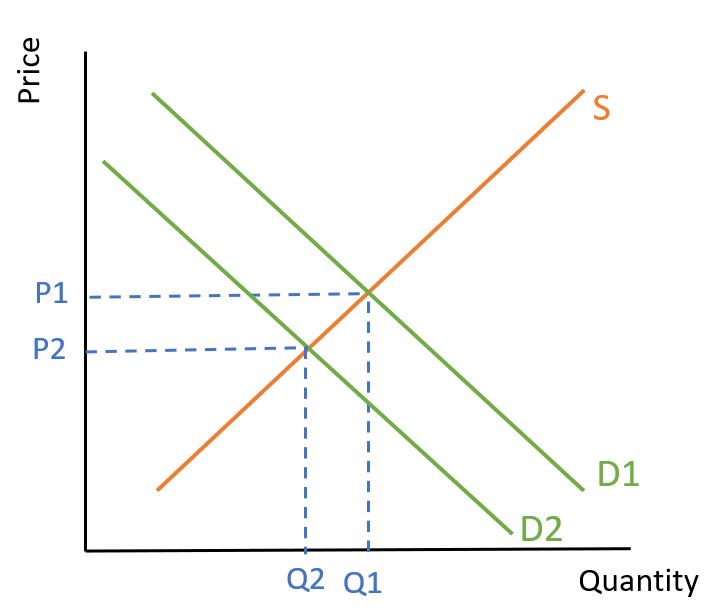
→ Demand shifts right → Higher Price → Higher Quantity

→ Supply shifts left → Higher Price → Lower Quantity
→ Supply shifts right → Lower Price → Higher Quantity
→ Demand shifts right → Supply shifts right → Price is unambiguously higher → Quantity may be higher or lower (depending on strength of shifts)

.JPG)

1.2.3 Consumer and producer surplus
- Define Consumer Surplus
- Define Producer Surplus
- Draw a demand curve showing consumer surplus at P1Q1
- Draw a supply curve showing producer surplus at P1Q1
- Define allocative efficiency in terms of consumer and producer surplus
The difference between what a consumer is willing to pay for a product and the price they actually pay.
The difference between the price received by firms for a good or service and the price at which they would have been prepared to supply the good or service.


Allocative efficiency occurs where consumer and producer surplus (community surplus) is maximised.
1.2.4 Price, income and cross price elasticities of demand, price elasticity of supply
- What is meant by 'elasticity'?
- Fill in the blank: If demand is price elastic it means that Quantity Demanded changes ____ than ______ following a change in price
- Fill in the blank: If demand is price inelastic, it means that Quantity Demanded changes ____ than ______ following a change in price.
- True/False: PED coefficient is always negative.
- What is the formula for PED?
- Fill in the blank: PED is Elastic Price Decreases Revenue _______
- Fill in the blank: PED is Elastic Price Increases Revenue _______
- Fill in the blank: PED is Inelastic Price Decreases Revenue _______
- Fill in the blank: PED is Inelastic Price Increases Revenue _______
- What is the PED value range for price Elastic Products?
- What is the PED value range for price Inelastic Products?
- What is the PED value for perfectly price Inelastic Products?
- What is the PED value for perfectly price Elastic Products?
- What is the PED value for Unit Elastic Products?
- Draw a Supply/Demand diagram to show the incidence of tax when Demand is Inelastic
- Draw a Supply/Demand diagram to show the incidence of tax when Demand is Elastic
- List the factors that will determine PED for a product.
- Increasing the availability of substitutes will make a product more __________.
- A product which is a necessity will have PED that is __________.
- A product which takes up a very small % of consumer income will have PED that is more __________.
- In general, over longer time periods products become more __________.
- The broader the definition of the product, the more __________ it will be.
- With a linear demand curve, the section with high price and low quantity (the seciton before the mid-point) will have _________ PED.
- With a linear demand curve, the section with low price and high quantity (the seciton after the mid-point) will have _________ PED.
- With a linear demand curve, the point right in the middle will have PED of _____. This is called _____ _____ PED.
- On a linear demand curve, revenue is maximised where PED = _____ .
- What is the formula for YED?
- Define Normal Goods.
- Define Inferior Goods.
- What is the YED range for Normal Goods?
- What is the YED range for Inferior Goods?
- What is the YED range for Luxury Goods?
- What is the YED range for Income Elastic Products?
- What is the YED range for Income Inlastic Products?
- What is the formula for XED?
- Draw the number line showing XED values, including Complements/Substitutes and Elastic/Inelastic
- What is the formula for Price Elasticity of Supply?
- Draw a Supply curve with Inelastic PES
- Draw a Supply curve with Elastic PES
- Draw a Supply curve with Perfectly Inelastic PES
- Draw a Supply curve with Perfectly Elastic PES
- What are the factors that will affect Price Elasticity of Supply?
The responsiveness of one variable to a change in another variable.
more . . . proportionally
less ... proportionally
True The law of demand states that we have an inverse relationship between price and quantity demanded.
Percentage Change Qd / Percentage Change Price

increases
decreases
decreases
increases
-∞ to -1

-1 to 0

0
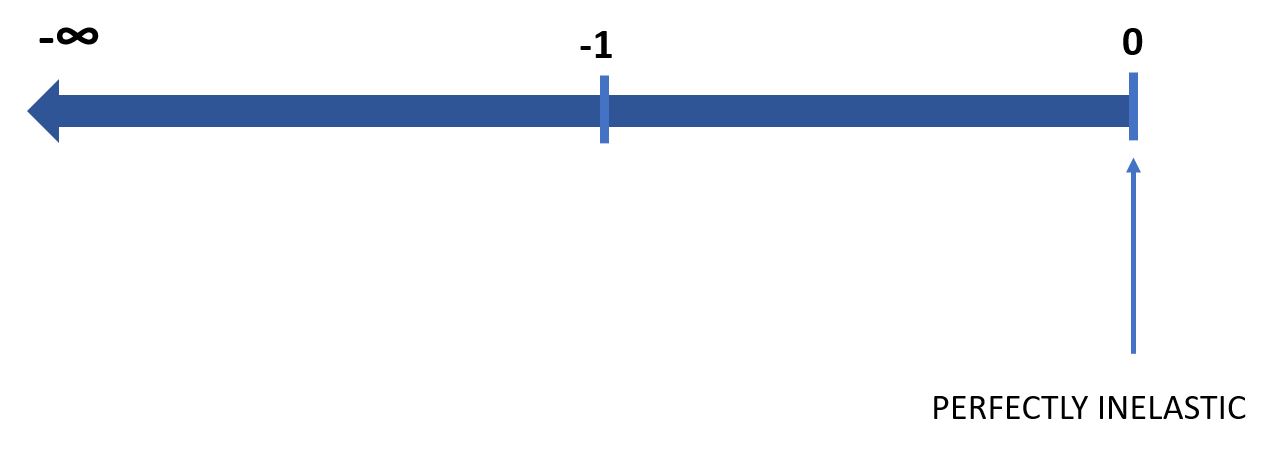
-∞
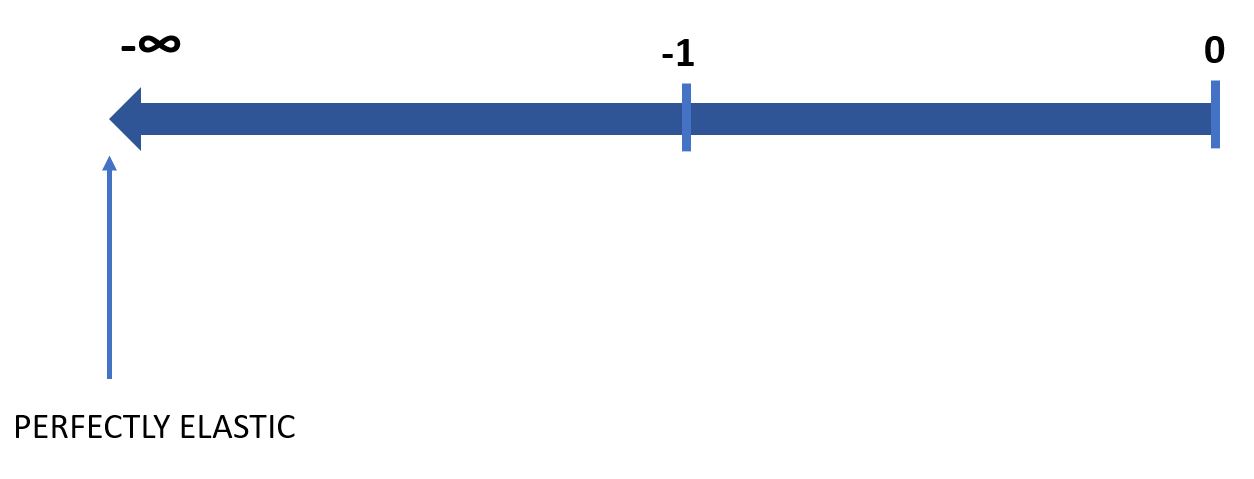
-1


-Availability of substitutes -The necessity of the item -Price in relation to income -Time -Breadth of product definition
Elastic
Inelastic
Inelastic
Elastic
Inelastic

elastic
inelastic

-1 . . . unit elastic
-1

Percentage Change Qd / Percentage Change Income

Goods where Quantity Demanded increases as income increases
Goods where Quantity Demanded decreases as income increases
0 to ∞ (Positive figure)

-∞ to 0 (Negaitive figure)

1 to ∞

-∞ to -1 and 1 to ∞

-1 to 1

Percentage Change QdGoodA / Percentage Change PGoodB


Percentage Change Qs / Percentage Change Price


→ Per Unit (Marginal) Costs → Time Horizon → How much it demands from its input markets → Agricultural Goods (I) vs Factory Goods (E) → Scope (Geographic Scope) of the market → Spare production capacity → Ease of factor substitutability/factor mobility → Stocks of finished products and components